Agreement Is Not Truth
Inter-annotator agreement is the most widely reported quality metric in data annotation. It measures whether people gave the same answer, which is a different thing from whether the answer was right.
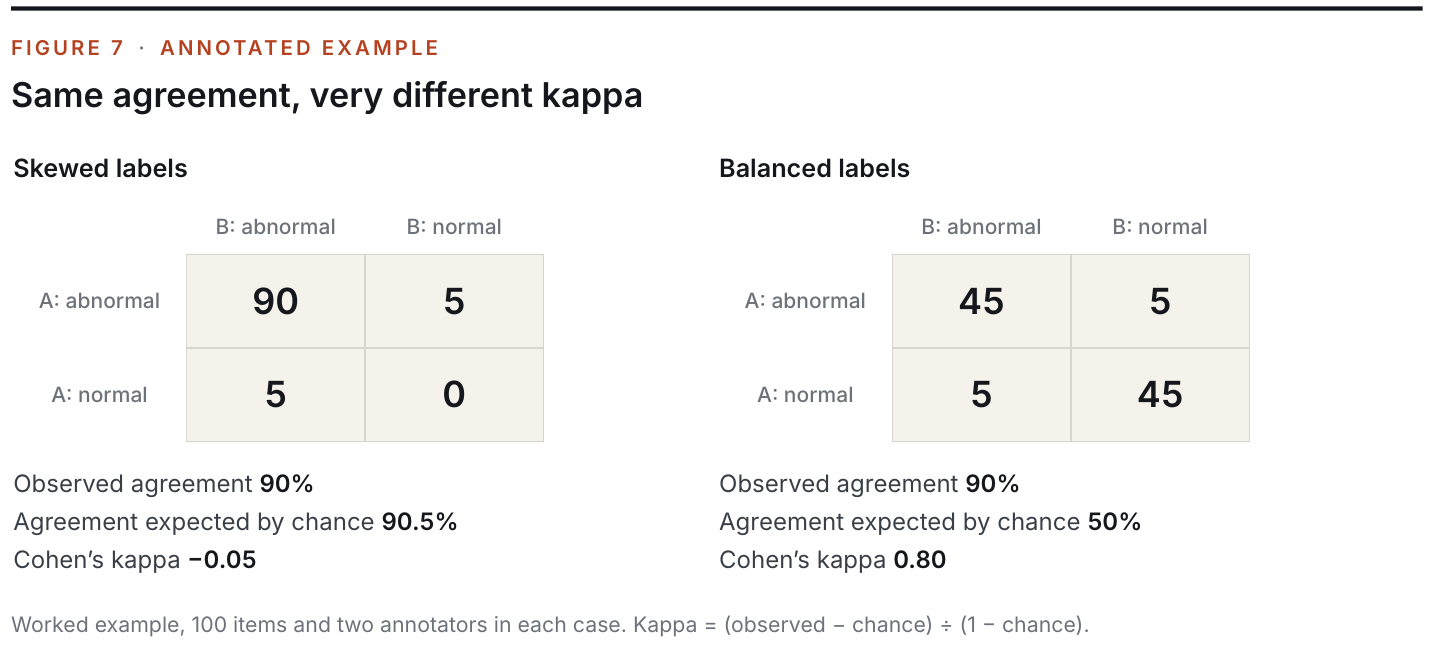
Two annotators label one hundred medical images as either “abnormal” or “normal”. They give the same label to ninety of them. Is that good?
Most people would say yes. Ninety per cent agreement sounds like a reliable process. Now add one detail. In all ninety cases of agreement, both annotators said “abnormal”. In the ten cases of disagreement, one said abnormal and the other normal, five each way. Neither annotator ever agreed with the other that an image was normal.
The standard statistic for this situation is Cohen’s kappa, which corrects observed agreement for the agreement expected by chance. Each annotator called 95% of images abnormal, so two people labelling independently at those rates would agree about 90.5% of the time. Observed agreement, at 90%, is slightly below that. Kappa comes out at roughly minus 0.05.
By the conventional reading, these two annotators agree no better than chance. By the raw percentage, they agree nine times in ten. Both numbers are computed correctly from the same table.
This is a known result, described by Feinstein and Cicchetti in 1990 as the paradox of high agreement but low kappa. It is also a good entry point to a larger problem. Agreement metrics are treated as measures of data quality. They measure something narrower, and they have properties that surprise people who rely on them.
What agreement statistics do
Cohen introduced kappa in 1960 to answer a specific question. If two raters assign items to categories, how much of their agreement exceeds what would occur if they were assigning at random according to their own base rates? Fleiss extended the idea to multiple raters. Krippendorff’s alpha generalises further, to any number of raters, missing data and ordinal or interval scales.
All three subtract chance agreement, and that subtraction is the source of both their value and their oddities. When one category is very common, chance agreement is high and there is little room above it. The statistic becomes unstable, and small changes in a handful of rare-category items move it a great deal. Since most real annotation tasks are imbalanced, with fraud, defects, tumours and toxic comments all being rare, this is the normal case.
Then there is the question of what counts as a good value. The most cited scale comes from Landis and Koch in 1977: values above 0.80 are “almost perfect”, 0.61 to 0.80 “substantial”, and so on. It is cited in thousands of papers as though it were a standard. The authors themselves described the divisions as clearly arbitrary, offered as a convenience for discussing one example. Krippendorff recommends 0.80 for reliable conclusions and 0.667 as the lowest level for tentative ones, and has been explicit that even these depend on what is at stake.
Artstein and Poesio’s survey of agreement in computational linguistics remains the best single treatment. Its recommendation is that researchers report the coefficient, the method, the number of annotators and categories, and the distribution, because the bare number cannot be interpreted without them. That advice is rarely followed.
Reliable is not the same as valid
Measurement theory distinguishes reliability from validity. A bathroom scale that reads three kilograms heavy every time is perfectly reliable and wrong. Agreement is a reliability measure. It says annotators behaved consistently with each other. It cannot say whether they were consistently correct.
There are at least three common ways to obtain high agreement on wrong labels.
Shared blind spots. If all annotators lack the same piece of expertise, they will make the same mistake. In the diabetic retinopathy literature, majority votes of general graders missed subtle findings that a panel of retinal specialists identified on discussion. The majority agreed. It was wrong in a consistent direction.
Guidelines that buy agreement. The quickest way to raise kappa is to add rules: when in doubt, choose category A; ignore anything smaller than twenty pixels; treat sarcasm as literal. Agreement rises because annotators are now applying the same convention, whether or not the convention matches what the model needs to learn.
Anchoring on a suggestion. When annotators correct machine-generated pre-labels instead of labelling from scratch, they tend to accept what they are shown. Studies of pre-annotation in linguistic and clinical text have found it speeds work and raises agreement, while also noting the risk that annotators reproduce the system’s errors. Two people who both accepted the same wrong suggestion are in full agreement.
In each case the agreement metric improves as the data gets worse.
Low agreement that is fine
The converse also holds. Agreement can be low on a dataset that is doing its job.
As the previous article in this series argued, some tasks do not have single answers. If the task is to rate how offensive a remark is, and the annotators were recruited to reflect a varied population, low agreement is an accurate measurement of a real spread in opinion. Raising it by homogenising the annotator pool would make the data less representative.
Reidsma and Carletta made a sharper version of the point in 2008. They simulated annotation with different kinds of disagreement and trained classifiers on the results. Disagreement that looked like random noise did relatively little harm to a learner even when agreement was modest. Disagreement that was systematic, where one annotator consistently differed in a patterned way, could mislead a learner even when overall agreement was high. Their conclusion was that the agreement coefficient alone does not tell you whether data is safe to learn from. The structure of the disagreement does.
In defence of the metric
None of this means agreement should not be measured. The case for it is strong.
It is cheap and it requires no ground truth. In most annotation projects there is no independent source of correct answers to compare against, and agreement is the only quality signal available at scale. It is an excellent diagnostic of guidelines: when agreement on a category collapses, the definition of that category is almost always the cause. And low agreement on a task that ought to have clear answers is real evidence of a problem, even if high agreement is not proof of its absence.
The trouble is with how it is used: as a single headline number, compared with a borrowed threshold, and reported as though it certified correctness.
Using agreement properly
A few habits make agreement statistics far more informative.
Report it per category. An overall kappa of 0.75 can conceal one category at 0.95 and another at 0.30. The second is where the model will fail.
Report prevalence alongside it. With the distribution of labels visible, a reader can tell whether a low kappa reflects real confusion or the imbalance effect. For rare classes, positive and negative agreement reported separately are more interpretable than a single chance-corrected figure.
Look at the confusion pattern. Which pairs of categories are confused, and by which annotators? Random scatter suggests difficulty. A consistent pattern from one person suggests a different reading of the guidelines.
Measure validity separately. Seed the work with items whose answers have been established by expert adjudication, and score annotators against them. This is a different measurement from agreement, and it is the only one that speaks to correctness.
Check agreement with experts, not only between peers. If generalist annotators agree with each other at 0.85 and with a domain expert at 0.55, the first number describes a shared misunderstanding.
Measure the same annotator twice. Intra-annotator agreement, obtained by quietly re-presenting a sample of items some weeks later, shows whether one person applies the guideline consistently over time. Someone who disagrees with their own earlier labels cannot be expected to agree with anyone else’s, and the usual cause is a guideline that leaves too much to memory and mood.
Be suspicious of sudden improvement. If agreement jumps after a guideline revision or after introducing pre-labels, find out whether annotators became more accurate or more alike.
What this changes
Never accept a dataset on a single agreement figure. Ask for per-class values, label prevalence and the confusion matrix between annotators.
Maintain an expert-adjudicated reference set and track accuracy against it as a separate metric from agreement.
When pre-labels are introduced, measure how often annotators override them on items known to be wrong.
Treat agreement thresholds in vendor agreements as a floor on process consistency, not a guarantee of correctness.
In specialised domains, require that agreement be measured against qualified experts as well as among annotators.
Ask what was done to reach the reported agreement. Guideline shortcuts that raise the number may lower the value of the data.
An honest quality report separates two questions that the industry usually merges: did annotators agree, and were they right. The first is measured by agreement statistics, with their caveats stated. The second needs an independent reference, built by people with the expertise to adjudicate. Reporting both, per category, is more work and produces less flattering numbers. It is also the only version a model team can act on.
- Cohen, J. (1960). “A Coefficient of Agreement for Nominal Scales.” Educational and Psychological Measurement.
- Fleiss, J. (1971). “Measuring nominal scale agreement among many raters.” Psychological Bulletin.
- Krippendorff, K. (2018). Content Analysis: An Introduction to Its Methodology, 4th edition. SAGE.
- Landis, J. R. and Koch, G. (1977). “The Measurement of Observer Agreement for Categorical Data.” Biometrics.
- Feinstein, A. and Cicchetti, D. (1990). “High agreement but low kappa: I. The problems of two paradoxes.” Journal of Clinical Epidemiology.
- Artstein, R. and Poesio, M. (2008). “Inter-Coder Agreement for Computational Linguistics.” Computational Linguistics.
- Reidsma, D. and Carletta, J. (2008). “Reliability Measurement without Limits.” Computational Linguistics.
- Krause, J. et al. (2018). “Grader Variability and the Importance of Reference Standards for Evaluating Machine Learning Models for Diabetic Retinopathy.” Ophthalmology.
- Fort, K. and Sagot, B. (2010). “Influence of Pre-annotation on POS-tagged Corpus Development.” ACL Linguistic Annotation Workshop.
- Lingren, T. et al. (2014). “Evaluating the impact of pre-annotation on annotation speed and potential bias: natural language processing gold standard development for clinical named entity recognition in clinical trial announcements.” Journal of the American Medical Informatics Association.
The data foundation enterprises trust to build reliable AI, since 2021.