Failures That Arrive Late
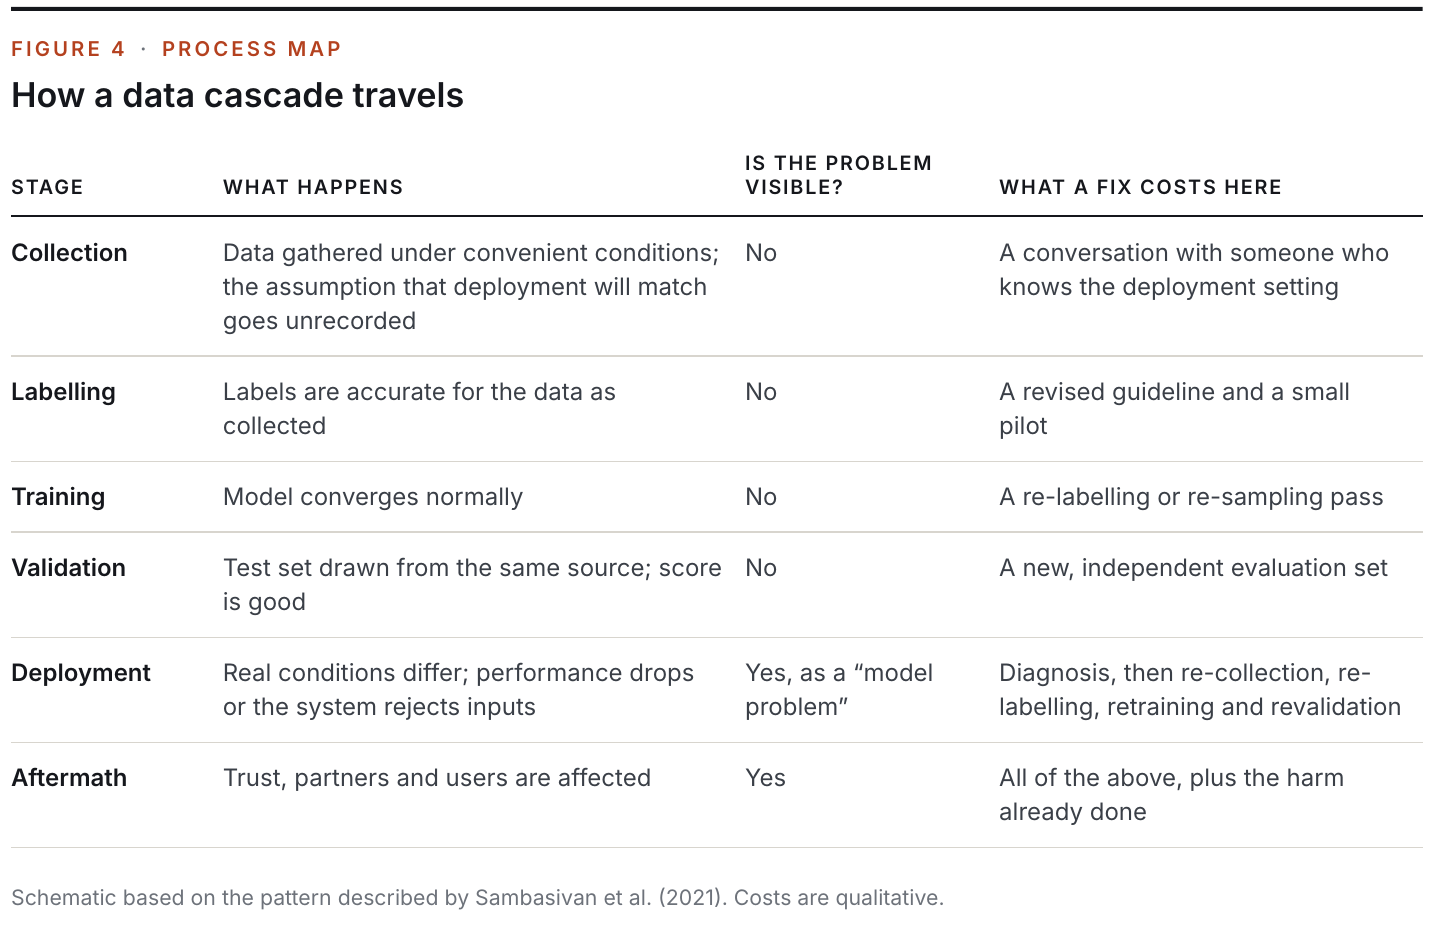
Data problems rarely announce themselves where they start. They surface months later, somewhere else, looking like a model problem.
A deep-learning system for detecting diabetic eye disease had performed at the level of specialist physicians in published studies. In 2018 and 2019, researchers from Google Health followed it into eleven clinics in Thailand to see how it worked in routine care.
The model’s accuracy was not the problem. The photographs were. Nurses were capturing retinal images in rooms where lighting could not always be controlled, on a schedule that left little time for retakes. The system had been built to reject images it judged too poor to grade, a sensible safeguard, and it rejected roughly a fifth of them. Patients whose images were rejected were told to travel to another facility on another day. Where internet connections were slow, uploads stalled and screening queues lengthened.
Nothing about this was visible in the model’s validation metrics. The training and test images had been collected under better conditions and graded by ophthalmologists. The assumption that deployment images would resemble them was made, implicitly, at the moment the dataset was assembled, and it was tested for the first time in a clinic.
Researchers have a name for this pattern.
Cascades
In 2021, Nithya Sambasivan and colleagues at Google published a study of how data problems unfold in practice. They interviewed 53 AI practitioners building high-stakes systems, in areas such as health, agriculture, credit and public safety, across India, East and West Africa and the United States.
They defined a data cascade as a compounding event that causes negative downstream effects from data issues. The properties they documented are what make cascades distinctive:
- They are opaque. There are no clear indicators, tools or metrics to detect them as they begin.
- They are delayed. Effects appear well after the decision that caused them, often in a different part of the system.
- They are compounding. Small early shortcuts interact and grow.
- They are common. Ninety-two per cent of the practitioners had experienced at least one. Forty-five per cent had experienced two or more.
The consequences reported were not marginal. Teams described discarding whole datasets and starting collection again, harm to the people the system was meant to serve, and strained relationships with partners.
Four triggers
The study traced cascades to four recurring causes. Each is recognisable to anyone who has shipped a model.
The physical world is brittle. Models trained on clean data met hardware that drifted, sensors that were moved, cameras with fingerprints on the lens, and environments that changed with the seasons. The Thai clinic lighting is this trigger exactly.
Domain expertise was missing where data was made. Practitioners took decisions about what to collect, how to label it and what to discard without the subject knowledge to see the consequences. In some cases the people who did have the knowledge, such as field workers or clinicians, were treated as data collectors and not consulted on what the data meant.
Incentives pointed elsewhere. Data work was undervalued relative to model work, inside teams and in the wider research culture. The study’s title is a direct quotation from an interviewee. Data collectors in the field were sometimes paid or assessed in ways that rewarded volume over care.
Documentation did not cross boundaries. Datasets passed between organisations with their assumptions unrecorded. Recipients did not know how fields had been defined, which records had been excluded, or why.
None of these is a labelling error in the narrow sense. A dataset can have perfectly accurate labels and still carry all four.
The same story in other fields
The medical-imaging literature contains several well-documented cascades, each discovered late.
Zech and colleagues trained a pneumonia detector on chest X-rays from multiple hospital systems and found it performed worse on data from a hospital it had not seen. Investigating why, they found the network could identify which hospital an image came from with high accuracy, using cues unrelated to disease. Because pneumonia prevalence differed sharply between sites, knowing the hospital was a useful shortcut. The model had learned, in part, to recognise the scanner.
During the pandemic, DeGrave and colleagues examined published models for detecting COVID-19 from radiographs. Many had been trained on datasets where positive and negative cases came from different sources. The models had learned to separate the sources, using markers such as text annotations on the films and patient positioning. Reported accuracy was high and largely illusory.
Oakden-Rayner and colleagues described a subtler version, which they called hidden stratification. A model can perform well on a labelled class overall while failing on an unlabelled subtype within it. In one of their examples, a pneumothorax detector appeared accurate largely because most positive images showed a chest drain, the visible sign of a case already treated. On the untreated cases that matter clinically, performance was much worse.
In each case the flaw was in how the data had been assembled. In each case the standard evaluation, drawn from the same flawed source, could not see it.
Why the delay is the expensive part
Software engineering has long observed that defects cost more to fix the later they are found. Data defects follow the same logic with an added complication: a model does not fail loudly when its data is wrong. It trains, converges and reports a good number.
Sculley and colleagues, in an influential 2015 paper on technical debt in machine-learning systems, made a related point. Data dependencies cost more than code dependencies because they are harder to detect. A change in an upstream data source can silently alter a model’s behaviour with no error and no failed build.
The practical consequence is that the cost of a data decision is not paid when it is made. It is paid after the model has been built on it, the product has been built on the model, and users have built their work on the product. By then, repair means re-collection, re-labelling, re-training, re-validation and, in regulated settings, re-approval.
Is this just a call for more process?
A reasonable sceptic would say that every engineering discipline produces papers lamenting that people do not document enough. Teams have deadlines. Exhaustive data validation before any modelling begins would mean many projects never start.
That is fair. The answer is not to front-load every possible check. Sambasivan’s own conclusion is more specific: most cascades the practitioners described were avoidable through earlier, modest interventions. The study argues for a shift from treating data quality as “goodness of fit” to a model, measured at the end, toward what it calls goodness of data, attended to throughout.
A second objection is that foundation models change the picture, since a team fine-tuning a pretrained model handles far less data than one training from scratch. The volume is smaller. The exposure is not. A pretrained model adapted on a small, unrepresentative sample inherits that sample’s assumptions with fewer examples to dilute them, and the evaluation set, typically drawn from the same sample, will again fail to notice.
Shortening the delay
If the defining feature of a cascade is the time between cause and discovery, the remedy is to shorten it.
Test against deployment conditions early. Before a dataset is finalised, collect a small sample from the real environment, with the real hardware, operators and constraints, and evaluate on it. The Thai clinics would have surfaced the image-quality issue with a few hundred photographs.
Put domain experts upstream. The person who knows that a chest drain signals a treated case should be involved when the labelling scheme is designed, not when the paper is reviewed.
Evaluate by slice. Aggregate metrics conceal exactly the failures described above. Results broken out by site, device, subgroup and subtype expose them.
Write down the assumptions. What was included, what was excluded, how categories were defined, what conditions the data was collected under. Documentation frameworks such as datasheets for datasets exist for this purpose, and their value is greatest at organisational boundaries.
Watch the inputs after launch. Production data drifts. Monitoring the distribution of what the model receives, not only what it outputs, is how the next cascade is caught early.
What this changes
For every dataset, state in writing how deployment data is expected to differ from it. If the answer is “it won’t”, test that claim first.
Look for shortcuts: can the model predict the data source, the device or the series site? If so, it may be using that to predict the label.
Hold out data by site, time or device, not only at random. Random splits hide distribution shift by construction.
Make data work visible in planning and review. If only model metrics are reported upward, only model work will be rewarded.
When data crosses a team or vendor boundary, require documentation of how it was collected, filtered and labelled.
Pilot in the least favourable realistic conditions, not the most favourable. The purpose of a pilot is to find the cascade.
Cascades are an organisational problem before they are a technical one: the people who make data and the people who use it are separated, and the assumptions do not travel between them. A data partner earns its place by closing that gap. That means asking where and how the model will run before a single item is labelled, bringing domain knowledge into guideline design, and handing over datasets with their assumptions written down.
- Sambasivan, N. et al. (2021). “Everyone wants to do the model work, not the data work: Data Cascades in High-Stakes AI.” ACM CHI.
- Beede, E. et al. (2020). “A Human-Centered Evaluation of a Deep Learning System Deployed in Clinics for the Detection of Diabetic Retinopathy.” ACM CHI.
- Zech, J. et al. (2018). “Variable generalization performance of a deep learning model to detect pneumonia in chest radiographs: A cross-sectional study.” PLOS Medicine.
- DeGrave, A., Janizek, J. and Lee, S.-I. (2021). “AI for radiographic COVID-19 detection selects shortcuts over signal.” Nature Machine Intelligence.
- Oakden-Rayner, L. et al. (2020). “Hidden Stratification Causes Clinically Meaningful Failures in Machine Learning for Medical Imaging.” ACM CHIL.
- Geirhos, R. et al. (2020). “Shortcut learning in deep neural networks.” Nature Machine Intelligence.
- Sculley, D. et al. (2015). “Hidden Technical Debt in Machine Learning Systems.” NeurIPS.
- Gebru, T. et al. (2021). “Datasheets for Datasets.” Communications of the ACM.
- Paleyes, A., Urma, R.-G. and Lawrence, N. (2022). “Challenges in Deploying Machine Learning: A Survey of Case Studies.” ACM Computing Surveys.
The data foundation enterprises trust to build reliable AI, since 2021.